

Today’s post is to address the perceptions vs. facts on Covid-19 and the degree as to how serious it is…or isn’t. Caveat: We are assuming that we can trust the sources and the integrity of the data presented by the CDC and Johns Hopkins and other respected organizations. At this time, we’re not going to address the economic impact of Covid-19, as we’ll save that for another post.
So let’s address the perceptions vs. facts on Covid-19 as it relates to the severity of its contagion and mortality rates. Then we’ll be in a better position to better ascertain whether or not government and health officials are over-dramatizing it’s health implications. Let’s begin…
There are many people questioning or doubting the severity of Covid-19 as presented by government and health officials. Are they over-blowing and dramatizing its contagious and destructive power? Most of the critiques we hear from the media, politicians and protesters regarding the lock-downs and social distancing policies, (people who maybe well-intentioned or not), usually fall short in applying comparative analysis of data and statistics available. That is, they are not comparing apples-with-apples when it comes to comparing Covid-19 data vs. the death rates of other diseases as they formulate their opinions. So, do we simply take their word for it and believe what they say? Certainly not! As we always encourage our client’s and reader’s of this blog…do your own research. Get properly informed! Then we can better understand the situation and make better decisions. So let’s get on with our discussion on the perceptions vs. facts on Covid-19.
I. Discerning Fact vs. Fiction:
At GMS Business Consulting, we have one simple rule to follow as a guiding principle in business; filter out all the “noise” by looking at the data, then compare apples-with-apples, and not apples-with-oranges. Here’s what we mean:
Many people are downplaying or misunderstanding the data and the significance of Covid-19, and believe we should just “get back to work.” “Just use a little hand sanitizer and sport a mask and all is well!” Let the “healthy” people go back to work!” We would agree for healthy people to be allowed to go back to work. We are all for it…if we can be assured that each state has the appropriate testing, medical equipment, medical staffing and policies in place. Currently, we don’t have those in place. Usually these same arguments for getting back to work before the fore-mentioned policies are in place, are followed-up by using comparative mortality rates of various illnesses to substantiate their views. What’s needed, is a clear foundational perspective on what to base a comparative analysis on when using data and statistical information.
II. Annual Deaths in the U.S.
- Number of deaths: 2,813,503
- Death rate: 863.8 deaths per 100,000 population
- Life expectancy: 78.6 years
- Infant Mortality rate: 5.79 deaths per 1,000 live births
- Source: CDC Deaths: Final Data for 2017, tables 1, 3, 13 pdf icon[PDF – 2 MB]
III. Leading Causes of Death Annually in the U.S.
- Heart disease: 647,457
- Cancer: 599,108
- Accidents (unintentional injuries): 169,936
- Chronic lower respiratory diseases: 160,201
- Stroke (cerebrovascular diseases): 146,383
- Alzheimer’s disease: 121,404
- Diabetes: 83,564
- Influenza and Pneumonia: 55,672
- Nephritis, nephrotic syndrome and nephrosis: 50,633
- Intentional self-harm (suicide): 47,173
- CDC – Fast Facts on disease in the U.S. https://www.cdc.gov/nchs/fastats/deaths.htm
- Source: CDC- Deaths: Final Data for 2017, table B pdf icon[PDF – 2 MB]
IV. Annual Flu/Influenza Infections & Deaths in the U.S.
Here’s a link and an excerpt to the CDC’s data on annual influenza: https://www.cdc.gov/flu/about/burden/index.html
- “A 2018 CDC study published in Clinical Infectious Diseasesexternal icon looked at the percentage of the U.S. population who were sickened by flu using two different methods and compared the findings. Both methods had similar findings, which suggested that on average, about 8% of the U.S. population gets sick from flu each season, with a range of between 3% and 11%, depending on the season.”
- Did you catch that? In any given year, approximately 8% of the U.S. population (8% of approx. 330,000,000 million people in the U.S.) equates to approximately 26,400,000 people become infected with the flu annually. Again, it’s about Perceptions vs. Facts on Covid-19.
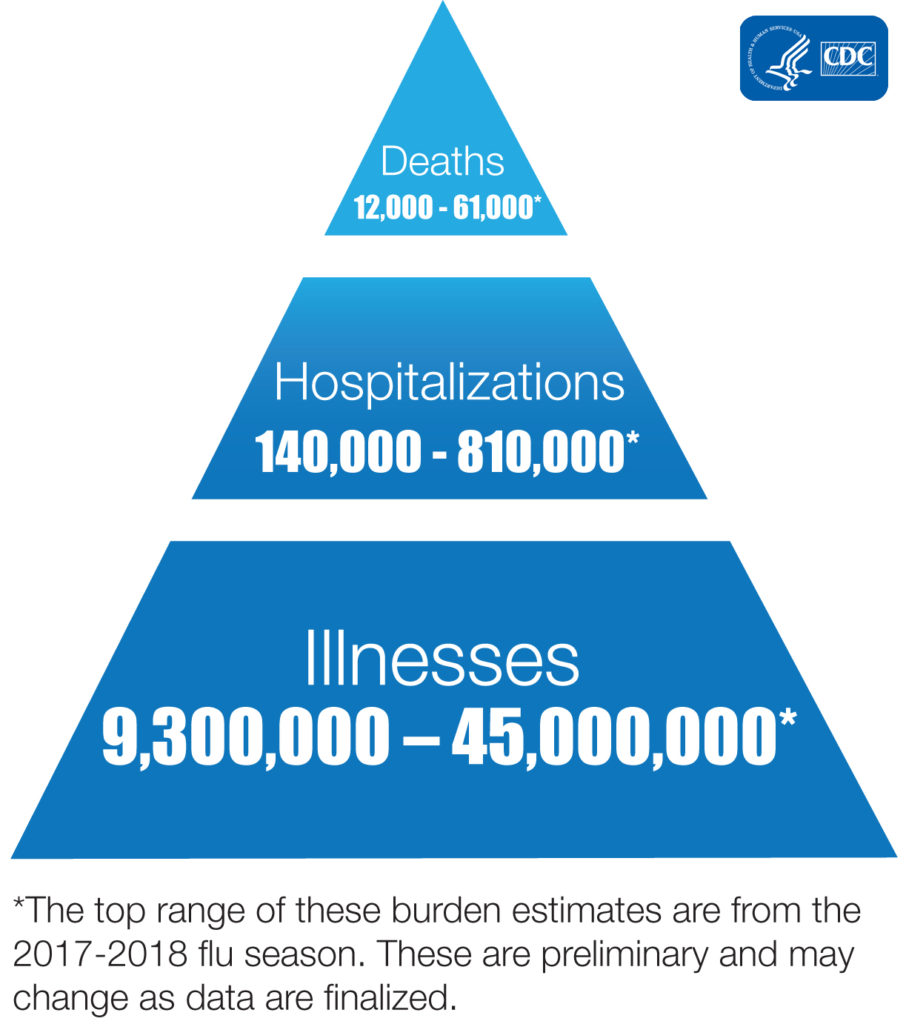
- The CDC estimates that influenza has resulted in between 9 million – 45 million illnesses, between 140,000 – 810,000 hospitalizations and between 12,000 – 61,000 deaths annually since 2010. This equates to an estimated mortality rate of approximately .10%
- Remember the above mortality rate and what it’s telling us in terms of the annual deaths from the flu in the U.S. versus Covid-19. Now lets take a look at Covid-19…
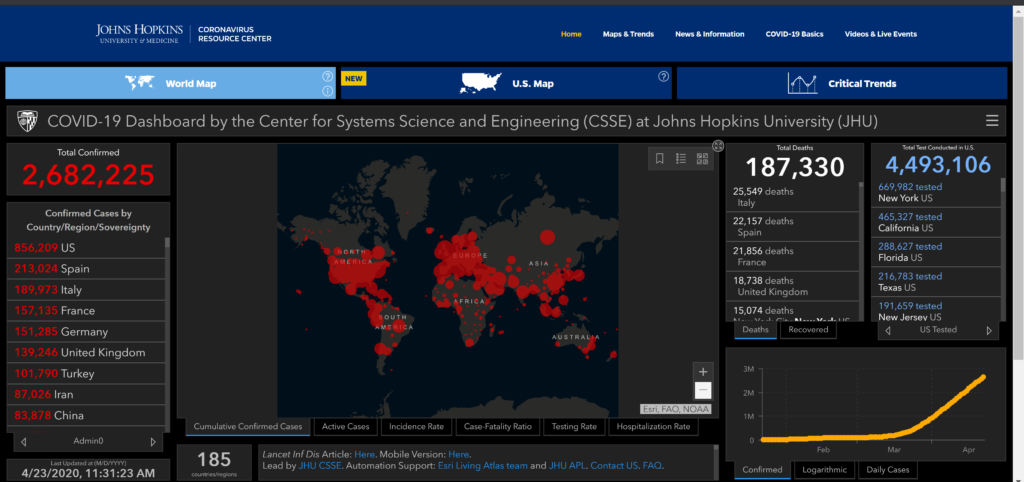
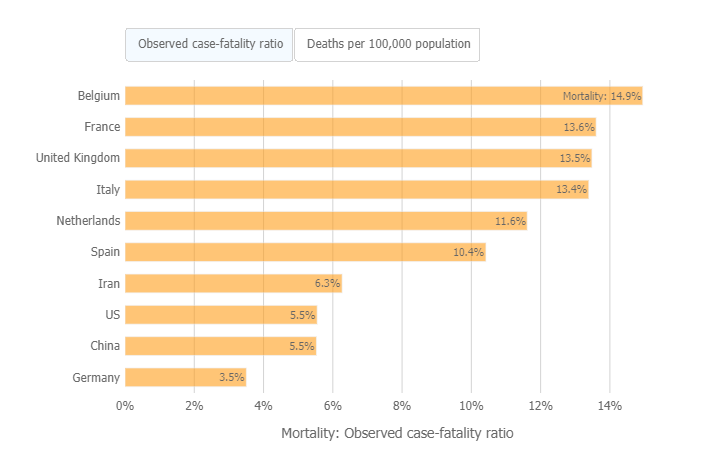
V. COVID-19 Cases and Mortality by Country AS OF 4-23-20.
| Country | Confirmed | Deaths | Case-Fatality | Deaths/100k pop. |
|---|---|---|---|---|
| US | 839,675 | 46,583 | 5.5% | 14.24 |
| Italy | 187,327 | 25,085 | 13.4% | 41.51 |
| Spain | 208,389 | 21,717 | 10.4% | 46.48 |
| France | 157,125 | 21,373 | 13.6% | 31.91 |
| United Kingdom | 134,638 | 18,151 | 13.5% | 27.30 |
| Belgium | 41,889 | 6,262 | 14.9% | 54.82 |
| Iran | 85,996 | 5,391 | 6.3% | 6.59 |
| Germany | 150,648 | 5,279 | 3.5% | 6.37 |
| China | 83,868 | 4,636 | 5.5% | 0.33 |
VI. Comparing Apples-to-Apples
Annual Flu – Contagiousness:
- CDC Link: https://www.cdc.gov/flu/about/keyfacts.htm
- You may be able to spread flu to someone else before you know you are sick, as well as while you are sick.
- People with flu are most contagious in the first 3-4 days after their illness begins.
- Some otherwise healthy adults may be able to infect others beginning 1 day before symptoms develop and up to 5 to 7 days after becoming sick.
- Remember the “average” annual contagion rate for the annual flu here in the U.S. is 8%, and a mortality rate of .10%.
Covid-19 – Period of Contagiousness:
- According to the CDC, the contagion infection of Covid-19 can be asymptomatic with no signs of infection or flu-like symptoms for as long as 2 weeks! This means the virus can spread exponentially faster than the regular flu because seemingly healthy people are able to spread the virus with anyone they come in contact with or touch any surface in their daily life for 2 WEEKS (and perhaps longer) without ever realizing they’re infected. Based on the data provided, the Covid-19 contagion and mortality rates are VASTLY different to the annual flu!
- As you see from the above chart, the current mortality rate here in the U.S. for Covid-19 is 5.5% vs. .10% for the annual flu! The differences in the infection rate and mortality rate of the annual flu vs. Covid-19 is very compelling.
- So let’s calculate a hypothetical “apples-to-apples- comparison of Covid-19 “assuming” an identical infection rate as the annual flu in the U.S. (Keeping in mind that Covid-19 is actually far more contagious than the annual flu, but for hypothetical purposes, we’ll apply the same infection rate):
- Using an infection rate of 8% on the U.S. population of 330,000,000 people:
- Annual Flu – Infections = 26,400,000. (avg. annual)
- Annual Flu – Death Rate using .10% = 26,400 deaths.
- Covid-19 – Infections = 26,400,000. (using same infection rate as the flu.)
- Covid-19 – Death Rate using 5.5% = 1,452,000 deaths.
- That’s an additional 1,425,000 potential deaths for the same amount of infections! And we know Covid-19 is far more infectious than the annual flu due to the asymptomatic incubation time that could be as much as two weeks or longer BEFORE any symptoms become present! In other words, this makes Covid-19 55 times more lethal than the annual flu, and we haven’t even touched on the point of demographics of those who have been hit hardest by this virus.
- Can you see why it’s important to compare apples-to-apples and not apples-to-oranges? This foundational comparison can help us better distinguish the perceptions vs. facts on Covid-19.
- Using an infection rate of 8% on the U.S. population of 330,000,000 people:
VI. Conclusion:
Again, assuming we can trust the sources and integrity of the data compiled by the various European countries, New York, the CDC, Johns Hopkins University and the like, it appears that Covid-19 is not like the annual flu…it’s much, much worse. Like many of you, we have family and friends who are medical professionals working in the hospitals and health centers. They can tell you their stories and experiences with Covid-19, and where the short comings of our healthcare system are. Our current medical system cannot handle much more than what they have recently faced. Consider us blessed and very fortunate! (Consider the bar chart above in comparison to other countries.) So what have we learned so far?
- Social distancing and stay-in lock-downs, face masks, and sanitizing may be an inconvenience, but it has worked so far! Compare the difference it has made versus what the European countries have endured! New York has similar results of Europe, as they only had a 1 week lag time over Italy.
- The main differences between the U.S. infection and mortality rates vs. the Europeans and New York, is that we had 2-3 more weeks lead-time (except New York) to prepare and put social distancing and stay-in policies in place.
- European countries and New York also utilize mass transit far more extensively than the rest of the U.S. Had the rest of the U.S. utilized mass transit and not had an extra few weeks lead time to prepare…our current results would more closely reflect European countries. (Look at the chart above)
- So what’s the answer? Do we continue leaving the restrictive policies in place a little while longer? Or do we prematurely open the country for business and risking a contagion and death rate that gets out of control. At what cost? Economics or lives? Who or what is your moral compass for making decisions like this? We would sure like to know the President’s and Governor’s. Fortunately, we don’t have to make that decision.
- Our point is, can we be a little more patient and let each state reopen for business if each state’s Governor can verifyably demonstrate the following:
- That their state has an effective Covid-19 policy in place.
- That their state has appropriate testing standards and equipment in place.
- That their state has the appropriate medical staffing and resources in place.
- If the Governor of each state can attest to their constituency, then they should be allowed to reopen for business.
- The economic effects that Covid-19 has been devastating not only in terms of magnitude, but in terms of the historical rate of speed which this has happened. Unfortunately, we have NOT begun to see the full repercussions.
- Nor have we seen the economic impact of all the digital stimulus money being printed, and what it will bring to bear in the future months and years to come.
- But we hope we have been able to at least present informative information to address the perceptions vs. facts on Covid-19 and the seriousness of this virus based on the statistical data provided.
- Unquestionably, we are living in unprecedented times, but if you’re a Christian, you should not be surprised by all this. The Bible warns us of times like these to come before the second coming of Jesus Christ. For those of you who are not Christians nor have ever read/studied the Bible, perhaps now is as good a time as any to do so.
- So what can we do? Can anything good come out of this? We’ll talk about that next week in our next post. Until then, we can all do the following:
- We can be patient with the social distancing policies.
- Help others who are in more need than we are.
- Do your own research,
- Make sure when using data/statistics to compare apples-to-apples…
- Pray and read your Bible. You will be enlightened with His promises and comforted with His peace.
- Until next week, be patient, stay safe and healthy.
GMS BUSINESS CONSULTING, INC. – provides lawyers/law firms, for-profit & non-profit organizations, and business professionals with Accounting Services, Business Development Services, Business Optimization Services, and Digital Marketing Services. We help business professionals strategically manage and tactically grow their businesses more effectively and efficiently. We do NOT provide investment advice. Contact Us if you are interested in learning more about our services, and in particular about M.A.P. (our 3-phase business development & management solution), designed to help you strategically manage and tactically grow your business. We would welcome the opportunity to speak with you.
info@gmsbusinessconsulting.com
707-218-3135